Tuesday, December 6, 2011

Markov-based Reliability Models. Part 1.

Hello dear readers,

Let me discuss a group of reliability models that have one common feature. These models are based on Markov chains.


Some history. In 1906, Andrey Markov presented the study of an important new type of chance processes. In this process, the outcome of a given experiment can affect the outcome of the next experiment. At the first time, a term ”chain” was used by Markov in [A. A. Markov. Rasprostranenie zakona bol’shih chisel na velichiny, zavisyaschie drug ot druga. Izvestiya Fiziko-matematicheskogo obschestva pri Kazanskom universitete, 15(2):135–156, 1906.]. He has produced the first results for these processes, purely theoretically. A generalization to countably infinite state spaces was given later by A. Kolmogorov in 1936. The Markov chains are related to Brownian motion and the ergodic hypothesis, two topics in physics which were important in the early years of the twentieth century, but Markov appears to have pursued this out of a mathematical motivation, namely the extension of the law of large numbers to dependent events. 
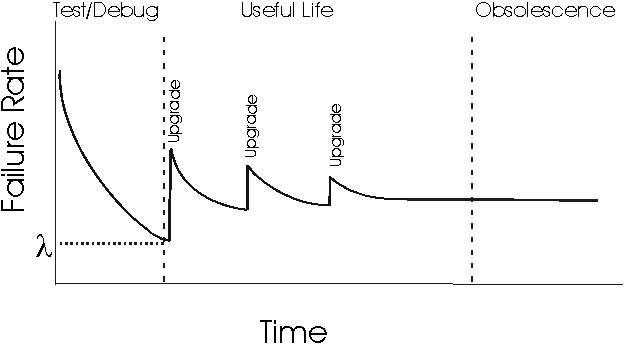
Nowadays, the Markov chains are widely used in the engineering domain for system analysis, modeling, and estimation of various non-functional system properties. An infinite number of books describe different types (discrete, continues, absorbing, ergodic, regular etc.) of Markov chains, using a bunch of complex probabilistic terms. The most understandable representation of a Markov chain is a directed state graph. The nodes of this graph - define state space of the system. The arcs - transitions form one state to another. These arcs are weighted with transition probabilities. The sum of the transition probabilities of outgoing arcs of each node equals to 1.

The next example gives an intuition into application of a Markov chain for simple reliability analysis. Assume, we have a faulty system that starts its regular operation. During this operation, a fault can be activated with a known probability P_FA. The fault activation leads to an erroneous system state. However, with the probability P_ED an error can be detected. After that, the error can be corrected with a probability P_EC that restores the original system state. Otherwise, the system stops with an error message (Fail stop) in oder to prevent a system failure. In the case if the erroneous system state is not identified, the systm fails.
This Markov chain describes behavior of the discussed system. 'Regular system operation' is an initial state of the system. We can see that with the probability P_FA it moves to 'erroneous system operation' and  successfully completes its operation with the probability (1-P_FA). Error detection behavior is modeled in the same manner. The final states 'Intended completion', 'Fail stop', and 'System failure' represent three possible system execution scenarios. In the case if the P_FA, P_ED, and P_EC are known, we are able to compute probabilities of these scenarios. For instance, the probability of a system failure equals to

P_SF = (P_FA)*(1-P_ED) + (P_FA)*(P_ED*P_EC)*(P_FA)*(1-P_ED) + (P_FA)*((P_ED*P_EC)*P_FA)^2*(1-P_ED) + ... =  P_FA*(1-P_ED) / (1-P_ED*P_EC*P_FA)

(1-P_SF)  represents the probability of failure free system execution and can be considered as a measure of system reliability. 

This trivial example demonstrates a very general idea of the Markov chain application for system reliability analysis. The state space of the Markov chain can be much bigger and e.g. distinguish between fault activations in different system components and/or different types of faults. The arcs also can represent a variety of system activities besides the fault activations. For example, error propagation or even control flow between the system components can be taken into account. In the next post I will discuss several more advanced Markov-based reliability models.

Wednesday, October 5, 2011

Keep it Simple, Keep it Reliable

Hello dear readers,

In this post I want to continue the discussion on software complexity and software reliability. The main idea has been already defined by the Einstein:

"Everything should be as simple as it is, but not simpler."

Now, let me talk a bit about existing SW reliability models (SRM). The earliest concepts of SW reliability engineering were adapted from the older techniques of HW reliability. However, the application of hardware methods to software has to be done with care, since there are fundamental differences in the nature of hardware and software faults. Since the last 20 years software reliability engineering is a separate domain. H. Pham gave a classification of actual software reliability models in his book "System software reliability". According to it, there are the following groups of SRM: error seeding models, failure rate models, curve fitting models, reliability growth models, time-series models, and non-homogeneous Poisson process models. These models are based on software metrics like lines of codes, number of operators and operands, cyclomatic complexity, object oriented metrics and many others. An overview of SW complexity metrics you can find in: "Object-oriented metrics - a survey" and "A survey of software metrics".

All of the defined SRM are Black-box Models that consider the software as an indivisible entity. A separate domain, which is more interesting for me, contains so-called Architecture-based SRM, like the ones described in: "Architecture-based approach to reliability assessment of software systems" and "An analytical approach to architecture-based software performance and reliability prediction". These type of the models consider software as a system of components with given failure rates or fault activation probabilities (those can be evaluated using the black box models). Reliability of the entire systems can be evaluated by processing information of system architecture, failure behavior, and single component properties. Most of these models are based on probabilistic mathematical frameworks like various Markov chains, stochastic Petri nets, stochastic process algebra, and probabilistic queuing networks. The architecture-based models help not only to evaluate reliability but also to detect unreliable parts of the system.

Returning to the topic, I want to refer to a very trivial principle: The simpler is SW, the more reliable is the SW. This idea is very transparent. The majority of SW faults are actually bugs that have been introduced during SW design or implementation. Complex SW contains more bugs.  Hence, the probability that one of these bugs will be activated is higher. This fact can be proven by any SRM. To make a reliable SW system you have to define a function of this system very strictly and clear and develop the SW just for this function. This principle is too straightforward, but it will help you to obtain a system "as simple as it is, but not simpler".

Sunday, May 22, 2011

SW and HW Reliability

Hello dear readers,

Today I want to start a discussion about SW complexity metrics and SW reliability models. Why? Hmm .. good question. So, some motivation in this post.

Majority of the dependability attributes are X-abilities. Where, X = Reli, Maintain, Avail (well, only three of them, but you get the idea). They are so-called Non Functional Properties (NFP) of the system. The wiki gives a complete list of the NFPs.

Typically NFPs are defined in terms of probability. For instance, one of definitions of system reliability: "The probability that a system will perform its intended function during a specified period of time under stated conditions". See - the probability of blah blah blah.

This definition originally addresses to HW domain or Traditional Reliability. Using different standards, testing approaches, statistical observation we can estimate such probabilities for a HW part of the system. Moreover, we can define not only the probability of failure-free execution, but a time-depending failure rate. It usually looks like a bathtub ("bathtub curve"):


Failure rate are linked with well-known reliability metrics like MTTF (Mean Time To Failure) or MTBF (Mean Time Between Failures). HW fails at the beggining of utilization (infant mortality) and at the end - because of wear out. If you'll try to map this concept to the SW you'll see something like this:


Short explanation of the SW-curve: SW reliability mostly depends on the number of unfixed bugs within the program. The curve shows that majority of these bugs can be handled during the testing phase of SDLC. Each new upgrade contains new bugs and makes the system more unreliable. It looks fine and gives an opportunity to evaluate reliability of SW+HW systems.

But ... there is a question - how to evaluate these probabilities of failure, failure rates, numbers of bugs, whatever of the new SW product? Run it 100000 times? Using what inputs? How to obtain info about operational profile of the system before utilization? and so on.

One of the answers - by an application of Software Complexity Metrics (SCM) and Software Reliability Models (SRM). The SW reliability community is agreed with the following assumption: There is a straight forward correlation between SW reliability and a number of bugs. Something like that:

Pr ( Failure ) = N_unfixed_bugs * some_coefficient

Initial number of unfixed bugs is evaluated using SCMs. SRMs, particularly growth and curve-fitting models, model the process of bug fixing and reliability increasing with the time.

Sunday, April 24, 2011

What Language Do We Speak?

Hello dear readers,

here is my very first post in the Dependable System (DS) blog. It is devoted to basic terminology of this research area. I've decided not to waste your time and without any useless discussion refer to a publication of one of the pioneers of dependability - Jean-Claude Laprie:

A. Avizienis, J.-C. Laprie and B. Randell: Fundamental Concepts of Dependability. Research Report No 1145, LAAS-CNRS, April 2001

This post gives a short summary of this article.

 "Fundamental Concepts of Dependability" outlined the results of nearly 20 years of activity in this domain and related ones. Introduced concept and the taxonomy will be used in my further posts. Next figure (taken from the article) shows co-called 'the dependability tree' that gives some intuition what is it all about:


Dependability is a system characteristic like functionality, performance or costs. Formal definition is as follows: "Dependability of a (computing) system is the ability to deliver service that can justifiably be trusted".

So according to "the dependability tree", we can describe it from 3 points of view: Attributes, means, and threats. Attributes - a kind of sub-characteristics of the dependability: 
  • Availability: readiness for correct service 
  • Reliability: continuity of correct service 
  • Safety: absence of catastrophic consequences on the user(s) and the environment 
  • Confidentiality: absence of unauthorized disclosure of information 
  • Integrity: absence of improper system state alterations 
  • Maintainability: ability to undergo repairs and modifications 
Means - goals of dependability analysis:
  • Fault prevention: how to prevent the occurrence or introduction of faults; 
  • Fault tolerance: how to deliver correct service in the presence of faults; 
  • Fault removal: how to reduce the number or severity of faults; 
  • Fault forecasting: how to estimate the present number, the future incidence, and the likely consequences of faults. 
Threats - classification of threats:
  • Fault is a defect on the system that can be activated and become a cause of an error (broken wire, electrical short, bug in a program). 
  • Error refers to incorrect internal state of the system or a discrepancy between the intended behavior of a system and its actual behavior inside the system boundary. 
  • Failure is an instance in time when a system displays behavior that is contrary to its specification. 
I want to tell a little bit more about the threats, because this concept is very interesting but not so obvious. Faults, errors and failures operate according to the chain shown in the next figure:


Fault activation can lead to an error. Once a fault is activated an error occurs. Examples of fault activation are execution of a line of code with a bug, an attempt to send a signal via corrupted connector or execution of a broken hardware part. An error may act in the same way as a fault. It can create further error’s conditions. An invalid state generated by the error may lead to another error or to a failure. Important to note, that failures are defined according to the system boundary. They are basically errors that have propagated out of the system and have become observable. If an error propagates outside the system boundary a failure is said to occur.

So, the general idea of the post: take a look at the papers of J.C Laprie to get basic definitions and classification.